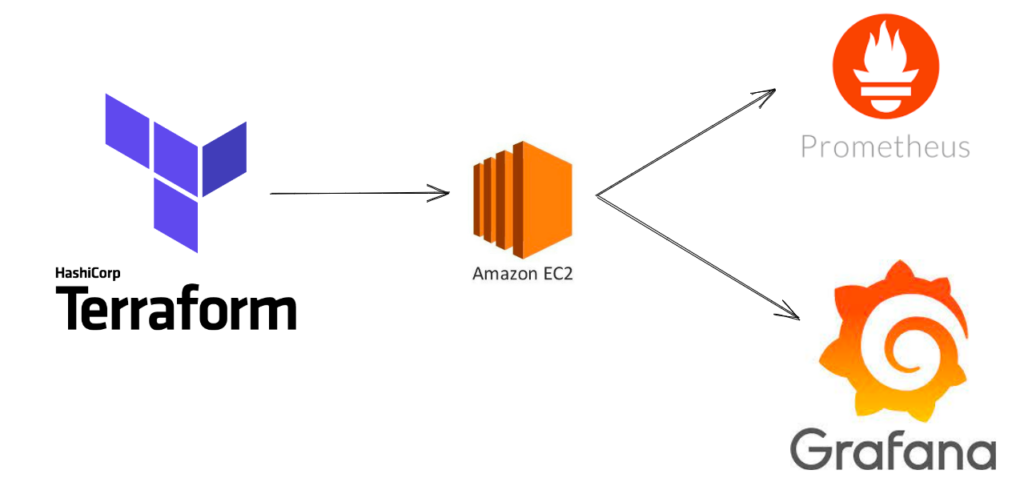
Provision and deploy the Prometheus and Grafana on AWS using Terraform and Docker.
Introduction
Clone the project locally to your Linux machine.
$ git clone git@github.com:ahamedyaserarafath/terraform_prometheus.git
In this post, we will deploy a Prometheus docker to AWS. We will use Terraform to provision a series of Elastic Cloud Compute (EC2) instances. The instances will be built from a basic ubuntu 18.04 AMI. We will install the docker and deploy the Prometheus. The Prometheus will discover the ec2 instance in the Singapore region(If you wish to change please add the respective region in yml file)
Pre-requisites
Before we get started installing the Prometheus stack on AWS.
- Ensure install the latest version of terraform is installed
- Create the IAM access in AWS to provision the ec2 instance, vpc, subnet, internet gateway, security group, and IAM.
Installation and configuration using terraform
If you want to change which targets should be monitored or make configuration changes edit the prometheus.yml file. The targets section is where you define what should be monitored by Prometheus(By default it monitors the EC2 instance)
The AWS will provision and those are added as a part of variables, if you wish to change please feel free to change in variable.tf alone.
In this project, we used the following provision.
- EC2 AMI – ami-0dad20bd1b9c8c004
- EC2 Instance Type – t2.micro
- Region – Singapore
- VPC – 11.0.0.0/16
- Subnet – 11.0.1.0/24
- Port Opened – 3000, 9090
In this project, the Prometheus will discover the ec2 instance across the Singapore region.
Steps to run the provisioning in terraform
- Terraform initialize a working directory
$ terraform init
- Terraform to create an execution plan
$ terraform plan
- Terraform apply to provision in aws
$ terraform apply
Note: The above command will provision the ec2 instance and install the Prometheus
Result
Apply complete! Resources: 13 added, 0 changed, 0 destroyed.  Outputs:
Grafana_URL = http://<your_public_ip>:3000
Prometheus_URL = http://<your_public_ip>:9090
Node Exporter Now Grafana and Prometheus are up and running. Now it’s time to run the node-exporter in the ec2 nodes which will send the metrics to Prometheus.
$ cd node-exporter
$ ./node_exporter.sh
Node exporter by default sends the metrics in 9100 and now you can see those metrics in Prometheus and grafana(which is used only for the UI dashboard)
https://github.com/ahamedyaserarafath/terraform_prometheus
GitHub Link, Please feel free to fork and use it